
“A small multiple is a series of similar graphs or charts using the same scale, allowing them to be easily compared it uses multiple views to show different partitions of a dataset ” (Tufte,1990). This can be using the same design, charts or colours to plot out changes in sequences.
This image below presents a list of boxes with colourful visuals and annotations underneath one another. In each box, the colours used are rather similar to each other in a harmonious way, using a repeated set of colour schemes altered slightly to create a difference in the category of each image and sequence.
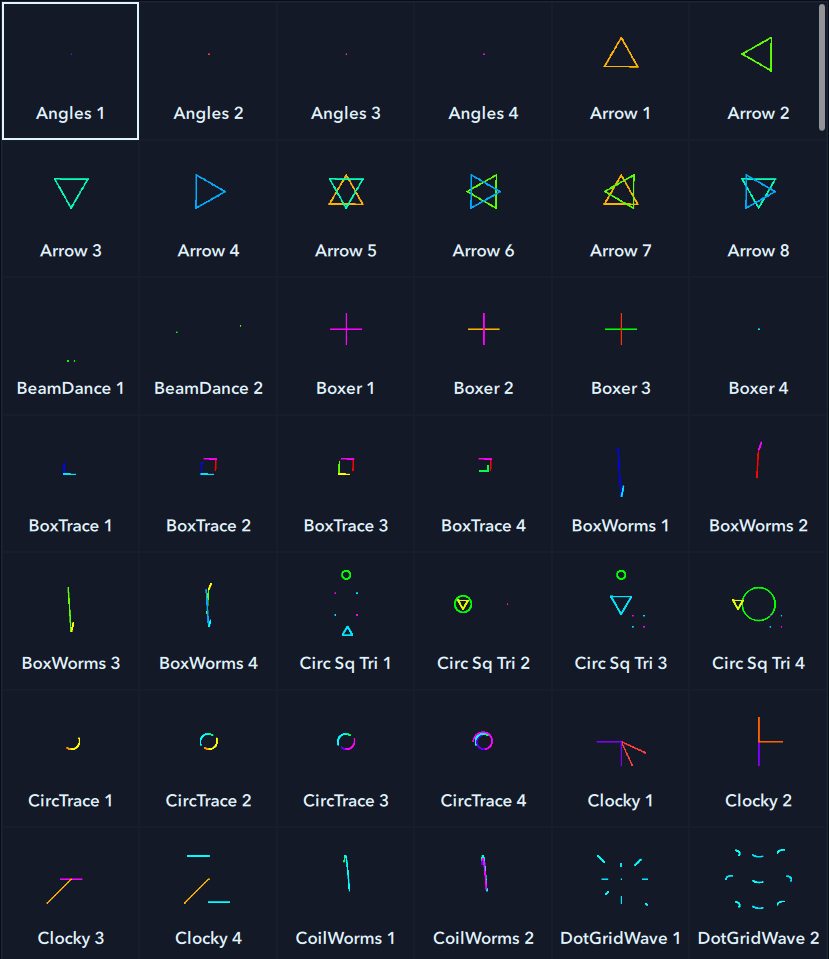
Here is a screenshot taken from the LaserOS software application, showing a range of sequences relating to Tufte’s theory of small multiples.
Tufte also states that”, Illustrations of postage-stamp size are indexed by category or a label, sequenced over time like the frames of a movie, or ordered by a quantitative variable not used in the single image itself.” This screenshot shows a few examples of graphics presenting small changes in data using shapes and colours altered slightly in each boxed section. By creating these alterations and positioning similar chunks of information, visual changes are perceived clearly without over-complicating each area of the screen, “Small Multiples reveal, all at once, a scope of alternatives, a range of options” (Tufte,1990). Another way a complication is kept under control would be the grid separating the visual information partly from one another, it organises the correct order with help from the text and doesn’t appear too dominant compared to the rest of the coloured visuals so the software is used with ease.
References:
Author: Anon / Title LaserCube- Worlds Smallest Laser Show Projector / Website: Portable Laser Show – The World’s Smallest Laser Show | LaserCube (laseros.com) (Accessed October 12 2021)
Tufte, Edward. R, 1990. Envisioning information